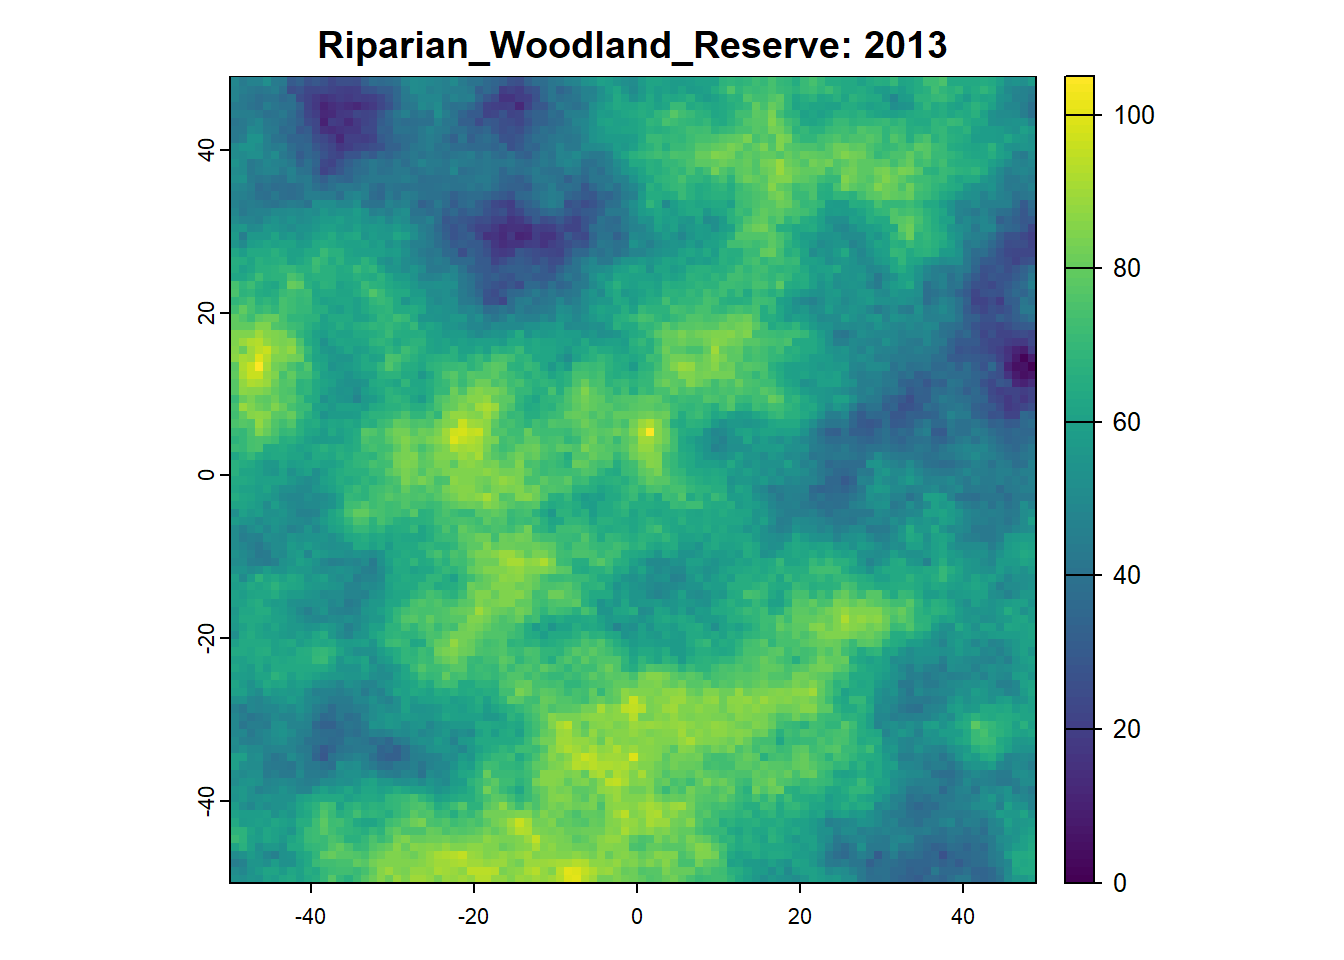
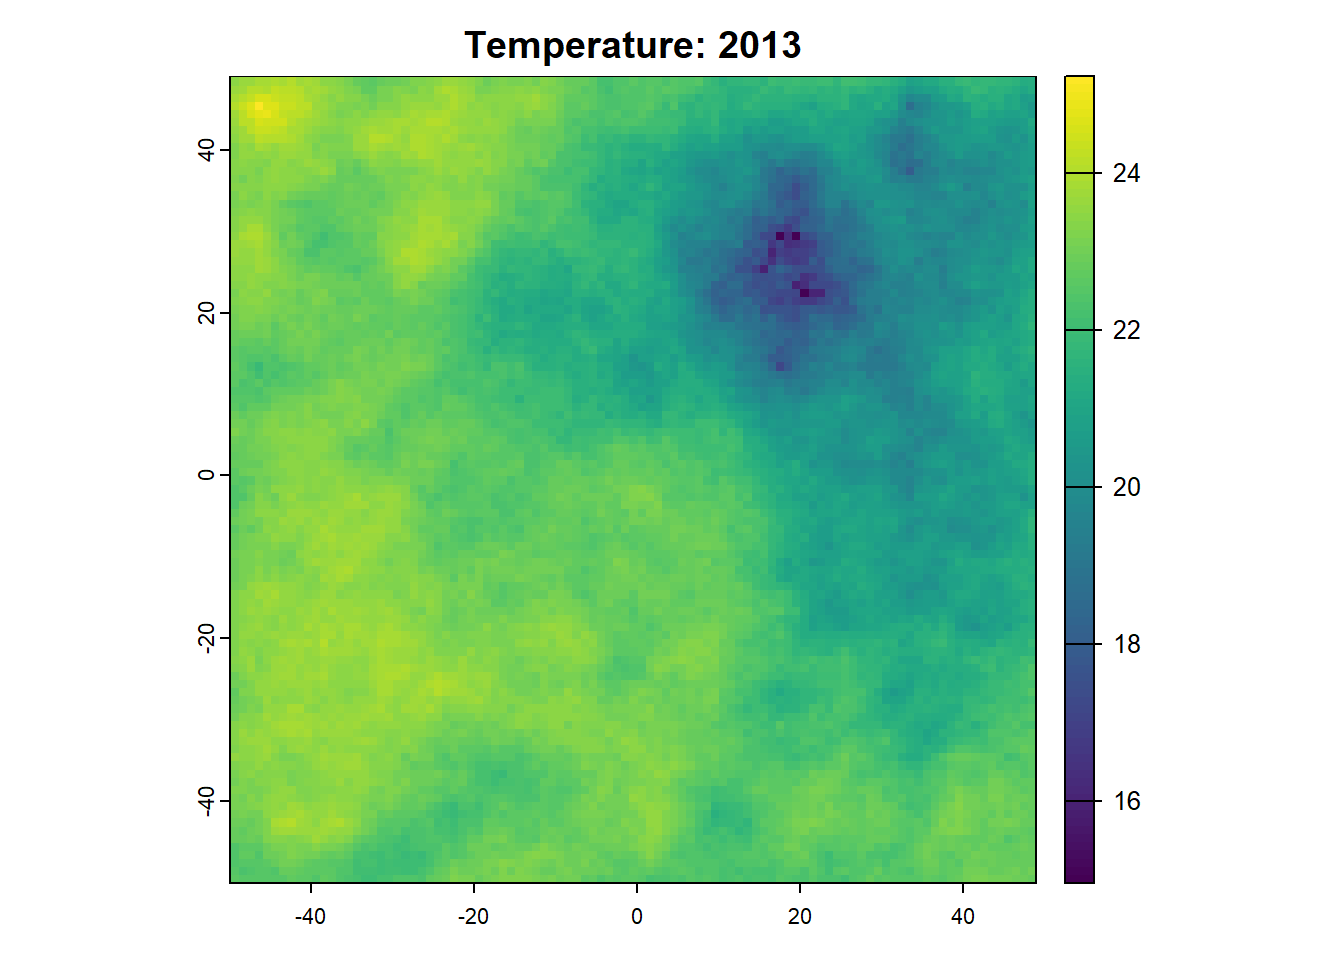
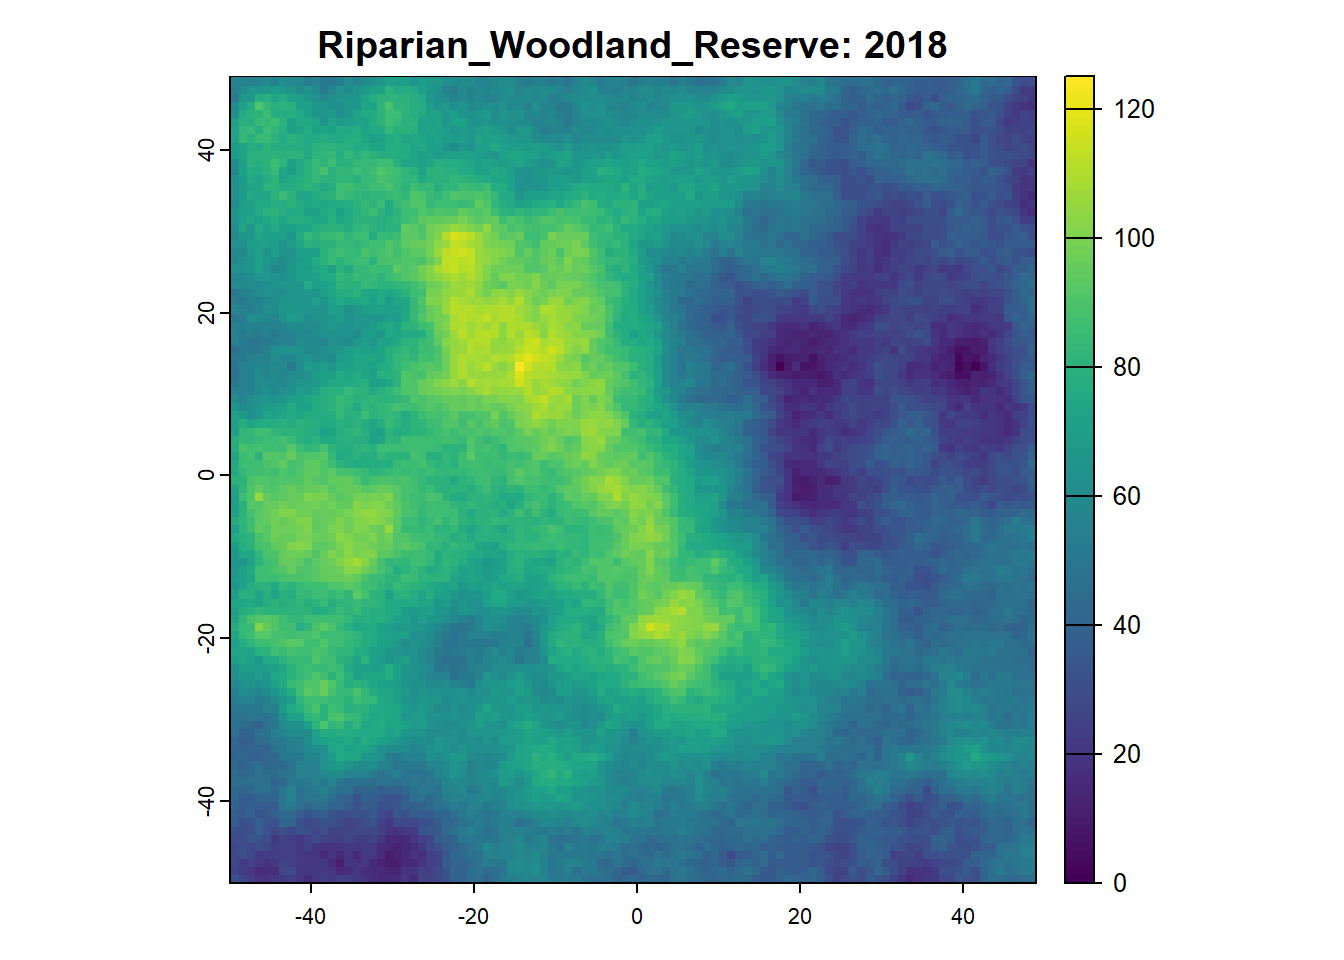
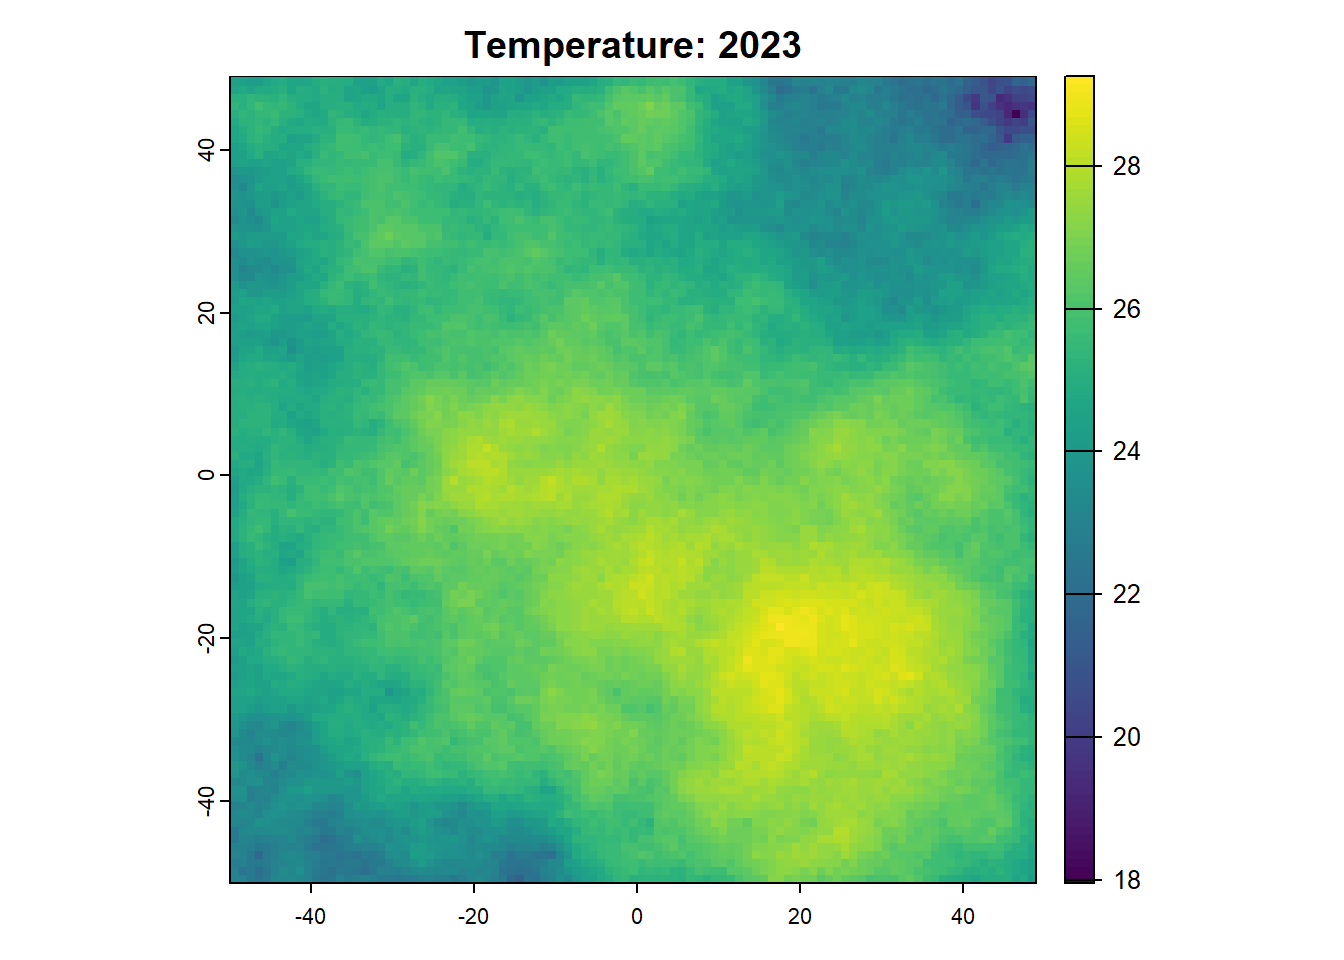
Once we want to run a project that is more sophisticated, we can start using SpaDES.project. SpaDES.projectSee here to see a longer list of project challenges .
We will demonstrate its use with an example created by Tati Micheletti where a workflow with several modules is setup and run.
SpaDES.project::setupProject
https://spades-project.predictiveecology.org/articles/i-getting-started.html
Installation
Code
<- c ("predictiveecology.r-universe.dev" , getOption ("repos" ))# if (!require("SpaDES.project")) :: Install (c ("SpaDES.project" , "SpaDES.core" , "reproducible" ), repos = repos, dependencies = TRUE )= SpaDES.project:: .libPathDefault ("~/SpaDES_book/integratingSpaDESmodules" )
Code
= SpaDES.project:: .libPathDefault ("PredictiveEcology.org" )
Using setupProject
setupProject does a series of very specific things, in a particular order, so that the chances of package conflicts and user errors are minimized.
Note how it downloads the listed modules directly from their GitHub repositories (e.g. tati-micheletti/speciesAbundance )
Code
##################### PART II: Download the modules and install the needed packages <- SpaDES.project:: setupProject (paths = list (projectPath = "~/SpaDES_book/integratingSpaDESmodules" ,packagePath = packagePath),modules = c ("tati-micheletti/speciesAbundance@main" ,"tati-micheletti/temperature@main" ,"tati-micheletti/speciesAbundTempLM@main" ),times = list (start = 2013 ,end = 2030 ),updateRprofile = FALSE
The output of setupProject is a list of argument values that can be passed to simInitAndSpaDES2 (with the “2” it accepts a list of arguments, instead of the arguments themselves).
Code
<- SpaDES.core:: simInitAndSpades2 (Setup)
Emergent workflow
We can evaluate the sequence of events using completed
Code
:: completed (results)
    eventTime         moduleName            eventType eventPriority
        <num>             <char>               <char>         <num>
 1:      2013         checkpoint                 init             0
 2:      2013               save                 init             0
 3:      2013           progress                 init             0
 4:      2013               load                 init             0
 5:      2013   speciesAbundance                 init             1
 6:      2013        temperature                 init             1
 7:      2013 speciesAbundTempLM                 init             1
 8:      2013   speciesAbundance       tableToRasters             5
 9:      2013   speciesAbundance                 plot             5
10:      2013        temperature         dataToRaster             5
11:      2013        temperature             plotting             5
12:      2013 speciesAbundTempLM        tableBuilding             5
13:      2014   speciesAbundance       tableToRasters             5
14:      2014        temperature         dataToRaster             5
15:      2014 speciesAbundTempLM        tableBuilding             5
16:      2015   speciesAbundance       tableToRasters             5
17:      2015        temperature         dataToRaster             5
18:      2015 speciesAbundTempLM        tableBuilding             5
19:      2016   speciesAbundance       tableToRasters             5
20:      2016        temperature         dataToRaster             5
21:      2016 speciesAbundTempLM        tableBuilding             5
22:      2017   speciesAbundance       tableToRasters             5
23:      2017        temperature         dataToRaster             5
24:      2017 speciesAbundTempLM        tableBuilding             5
25:      2018   speciesAbundance                 plot             5
26:      2018   speciesAbundance       tableToRasters             5
27:      2018        temperature         dataToRaster             5
28:      2018 speciesAbundTempLM        tableBuilding             5
29:      2019   speciesAbundance       tableToRasters             5
30:      2019        temperature         dataToRaster             5
31:      2019 speciesAbundTempLM        tableBuilding             5
32:      2020   speciesAbundance       tableToRasters             5
33:      2020        temperature         dataToRaster             5
34:      2020 speciesAbundTempLM        tableBuilding             5
35:      2021   speciesAbundance       tableToRasters             5
36:      2021        temperature         dataToRaster             5
37:      2021 speciesAbundTempLM        tableBuilding             5
38:      2022   speciesAbundance       tableToRasters             5
39:      2022        temperature         dataToRaster             5
40:      2022 speciesAbundTempLM        tableBuilding             5
41:      2023        temperature             plotting             5
42:      2023        temperature         dataToRaster             5
43:      2023 speciesAbundTempLM        tableBuilding             5
44:      2023 speciesAbundTempLM        modelBuilding             5
45:      2023 speciesAbundTempLM abundanceForecasting             5
46:      2023 speciesAbundTempLM                 plot             5
47:      2024        temperature         dataToRaster             5
48:      2024 speciesAbundTempLM abundanceForecasting             5
49:      2024 speciesAbundTempLM                 plot             5
50:      2025        temperature         dataToRaster             5
51:      2025 speciesAbundTempLM abundanceForecasting             5
52:      2025 speciesAbundTempLM                 plot             5
53:      2026        temperature         dataToRaster             5
54:      2026 speciesAbundTempLM abundanceForecasting             5
55:      2026 speciesAbundTempLM                 plot             5
56:      2027        temperature         dataToRaster             5
57:      2027 speciesAbundTempLM abundanceForecasting             5
58:      2027 speciesAbundTempLM                 plot             5
59:      2028        temperature         dataToRaster             5
60:      2028 speciesAbundTempLM abundanceForecasting             5
61:      2028 speciesAbundTempLM                 plot             5
62:      2029        temperature         dataToRaster             5
63:      2029 speciesAbundTempLM abundanceForecasting             5
64:      2029 speciesAbundTempLM                 plot             5
65:      2030        temperature         dataToRaster             5
66:      2030 speciesAbundTempLM abundanceForecasting             5
67:      2030 speciesAbundTempLM                 plot             5
    eventTime         moduleName            eventType eventPriority
    ._prevEventTimeFinish           clockTime
                   <POSc>              <POSc>
 1:   2024-09-18 08:36:00 2024-09-18 08:36:00
 2:   2024-09-18 08:36:00 2024-09-18 08:36:00
 3:   2024-09-18 08:36:00 2024-09-18 08:36:00
 4:   2024-09-18 08:36:00 2024-09-18 08:36:00
 5:   2024-09-18 08:36:00 2024-09-18 08:36:00
 6:   2024-09-18 08:36:00 2024-09-18 08:36:00
 7:   2024-09-18 08:36:00 2024-09-18 08:36:00
 8:   2024-09-18 08:36:00 2024-09-18 08:36:00
 9:   2024-09-18 08:36:00 2024-09-18 08:36:00
10:   2024-09-18 08:36:00 2024-09-18 08:36:00
11:   2024-09-18 08:36:00 2024-09-18 08:36:00
12:   2024-09-18 08:36:00 2024-09-18 08:36:00
13:   2024-09-18 08:36:00 2024-09-18 08:36:00
14:   2024-09-18 08:36:00 2024-09-18 08:36:00
15:   2024-09-18 08:36:00 2024-09-18 08:36:00
16:   2024-09-18 08:36:00 2024-09-18 08:36:00
17:   2024-09-18 08:36:00 2024-09-18 08:36:00
18:   2024-09-18 08:36:00 2024-09-18 08:36:00
19:   2024-09-18 08:36:00 2024-09-18 08:36:01
20:   2024-09-18 08:36:01 2024-09-18 08:36:01
21:   2024-09-18 08:36:01 2024-09-18 08:36:01
22:   2024-09-18 08:36:01 2024-09-18 08:36:01
23:   2024-09-18 08:36:01 2024-09-18 08:36:01
24:   2024-09-18 08:36:01 2024-09-18 08:36:01
25:   2024-09-18 08:36:01 2024-09-18 08:36:01
26:   2024-09-18 08:36:01 2024-09-18 08:36:01
27:   2024-09-18 08:36:01 2024-09-18 08:36:01
28:   2024-09-18 08:36:01 2024-09-18 08:36:01
29:   2024-09-18 08:36:01 2024-09-18 08:36:01
30:   2024-09-18 08:36:01 2024-09-18 08:36:01
31:   2024-09-18 08:36:01 2024-09-18 08:36:01
32:   2024-09-18 08:36:01 2024-09-18 08:36:01
33:   2024-09-18 08:36:01 2024-09-18 08:36:01
34:   2024-09-18 08:36:01 2024-09-18 08:36:01
35:   2024-09-18 08:36:01 2024-09-18 08:36:01
36:   2024-09-18 08:36:01 2024-09-18 08:36:01
37:   2024-09-18 08:36:01 2024-09-18 08:36:01
38:   2024-09-18 08:36:01 2024-09-18 08:36:01
39:   2024-09-18 08:36:01 2024-09-18 08:36:01
40:   2024-09-18 08:36:01 2024-09-18 08:36:01
41:   2024-09-18 08:36:01 2024-09-18 08:36:01
42:   2024-09-18 08:36:01 2024-09-18 08:36:01
43:   2024-09-18 08:36:01 2024-09-18 08:36:01
44:   2024-09-18 08:36:01 2024-09-18 08:36:01
45:   2024-09-18 08:36:01 2024-09-18 08:36:01
46:   2024-09-18 08:36:01 2024-09-18 08:36:01
47:   2024-09-18 08:36:01 2024-09-18 08:36:01
48:   2024-09-18 08:36:01 2024-09-18 08:36:01
49:   2024-09-18 08:36:01 2024-09-18 08:36:01
50:   2024-09-18 08:36:01 2024-09-18 08:36:01
51:   2024-09-18 08:36:01 2024-09-18 08:36:01
52:   2024-09-18 08:36:01 2024-09-18 08:36:02
53:   2024-09-18 08:36:02 2024-09-18 08:36:02
54:   2024-09-18 08:36:02 2024-09-18 08:36:02
55:   2024-09-18 08:36:02 2024-09-18 08:36:02
56:   2024-09-18 08:36:02 2024-09-18 08:36:02
57:   2024-09-18 08:36:02 2024-09-18 08:36:02
58:   2024-09-18 08:36:02 2024-09-18 08:36:02
59:   2024-09-18 08:36:02 2024-09-18 08:36:02
60:   2024-09-18 08:36:02 2024-09-18 08:36:02
61:   2024-09-18 08:36:02 2024-09-18 08:36:02
62:   2024-09-18 08:36:02 2024-09-18 08:36:02
63:   2024-09-18 08:36:02 2024-09-18 08:36:02
64:   2024-09-18 08:36:02 2024-09-18 08:36:02
65:   2024-09-18 08:36:02 2024-09-18 08:36:02
66:   2024-09-18 08:36:02 2024-09-18 08:36:02
67:   2024-09-18 08:36:02 2024-09-18 08:36:02
    ._prevEventTimeFinish           clockTime
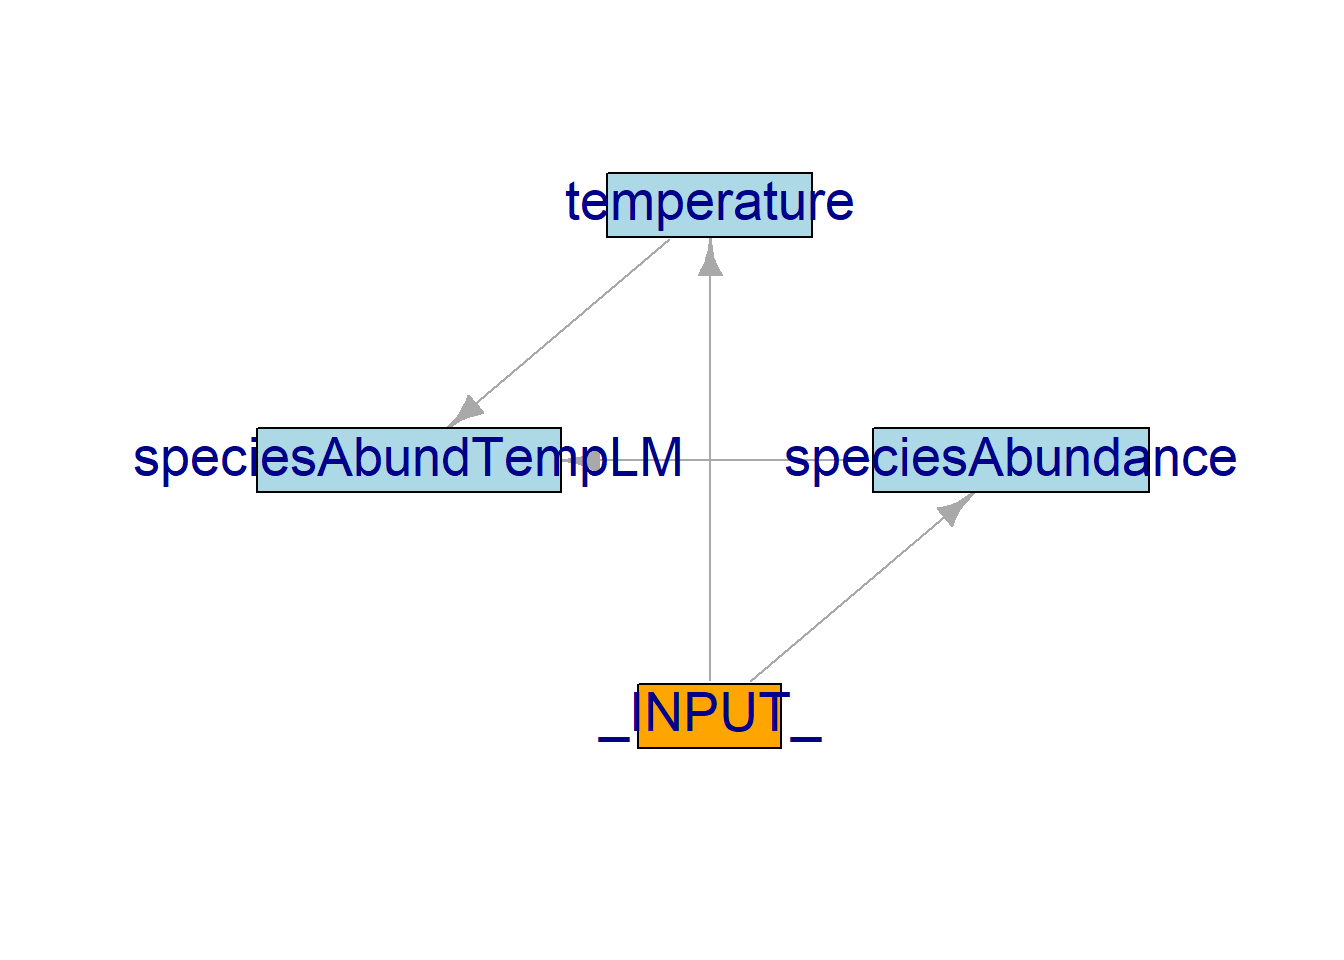
We can also see how modules and objects interact using the functions objectDiagram() and moduleDiagram().
Modules’ diagram showing the interactions among modules:
Code
:: moduleDiagram (results)
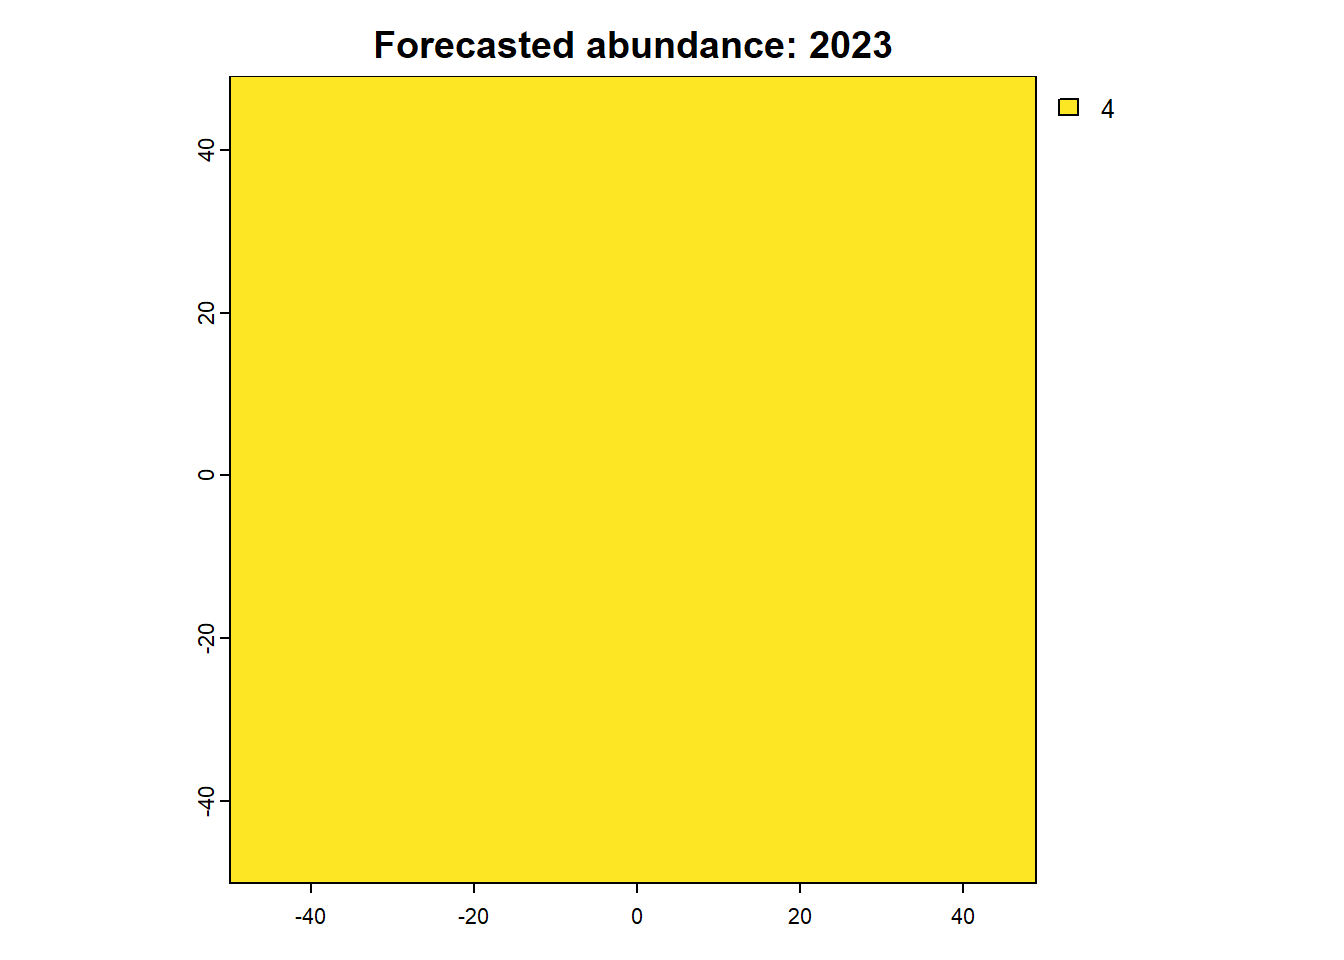
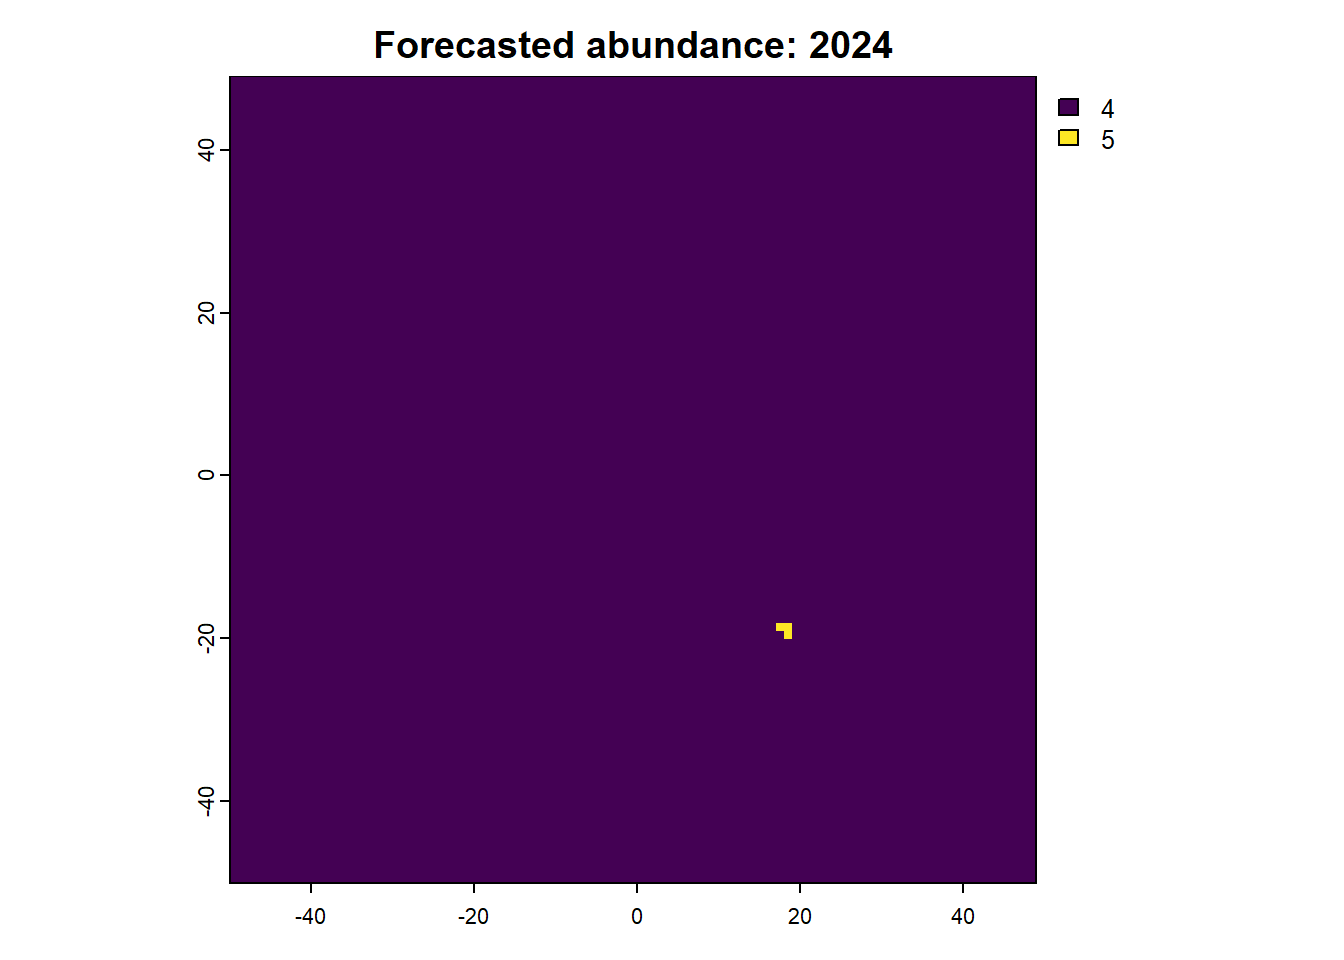
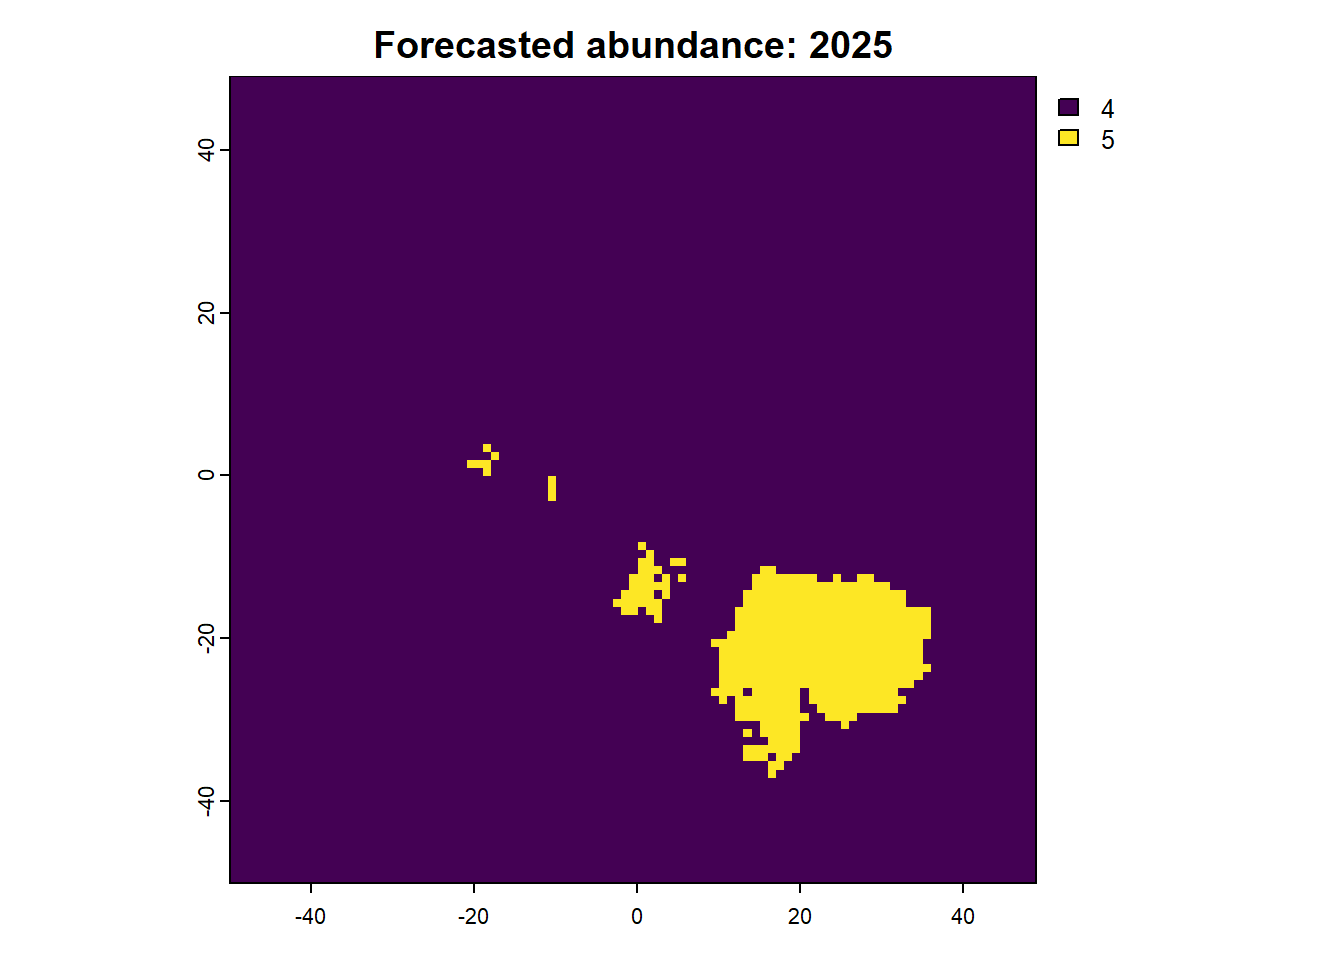
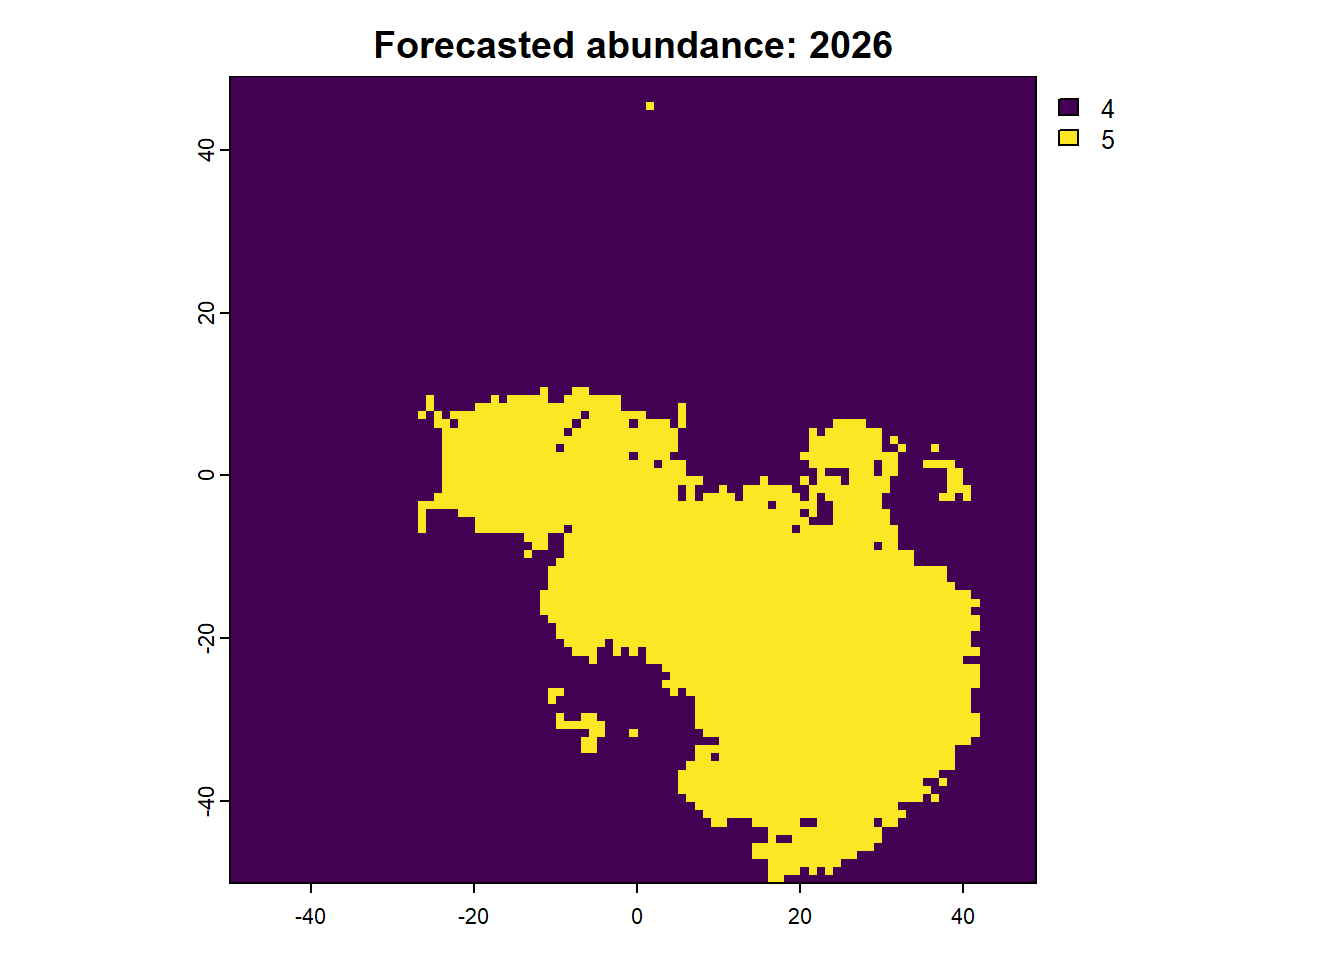
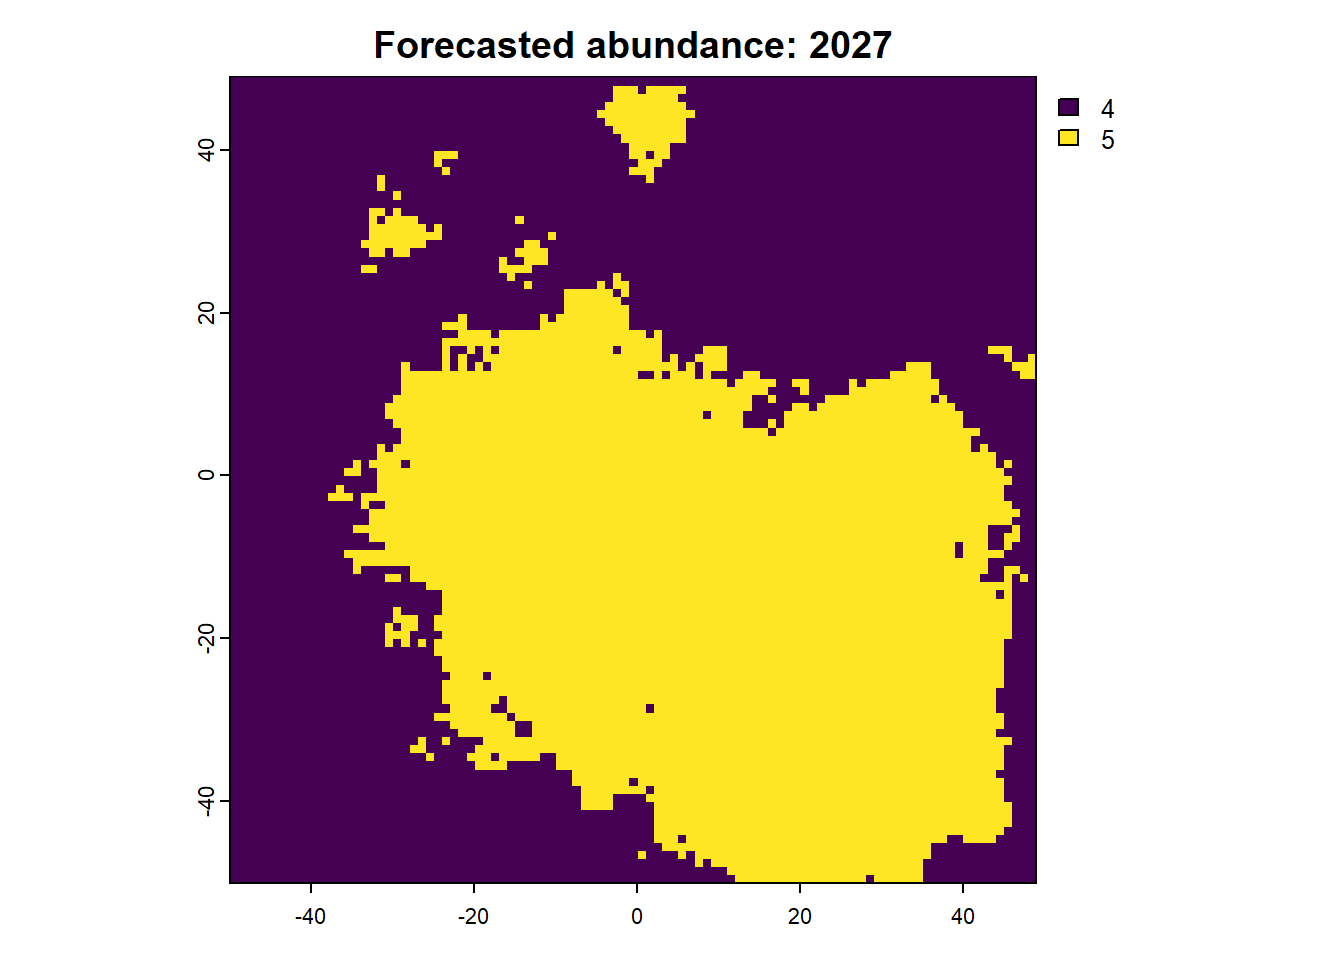
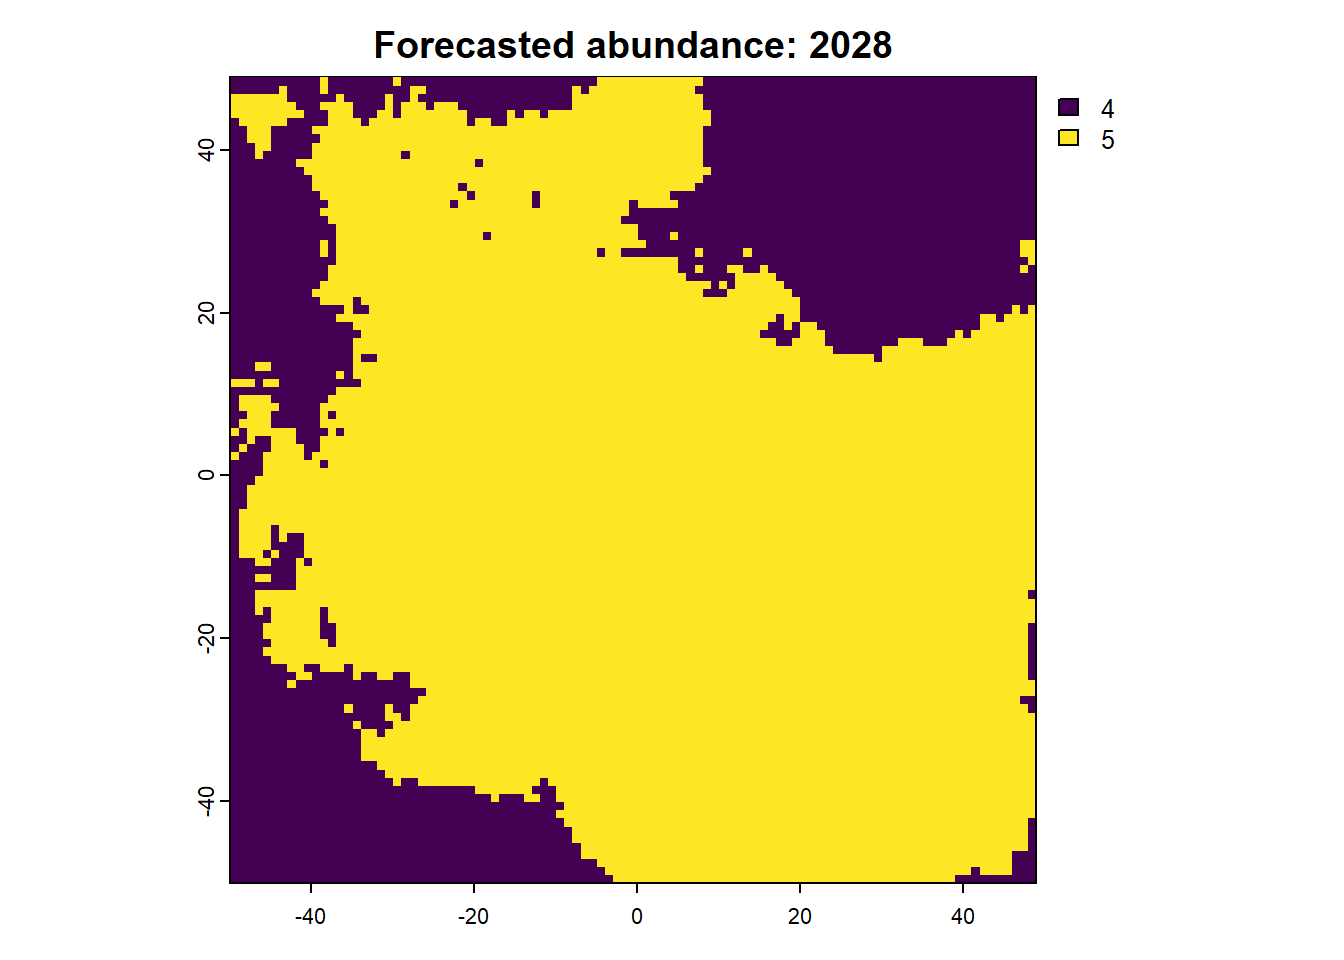
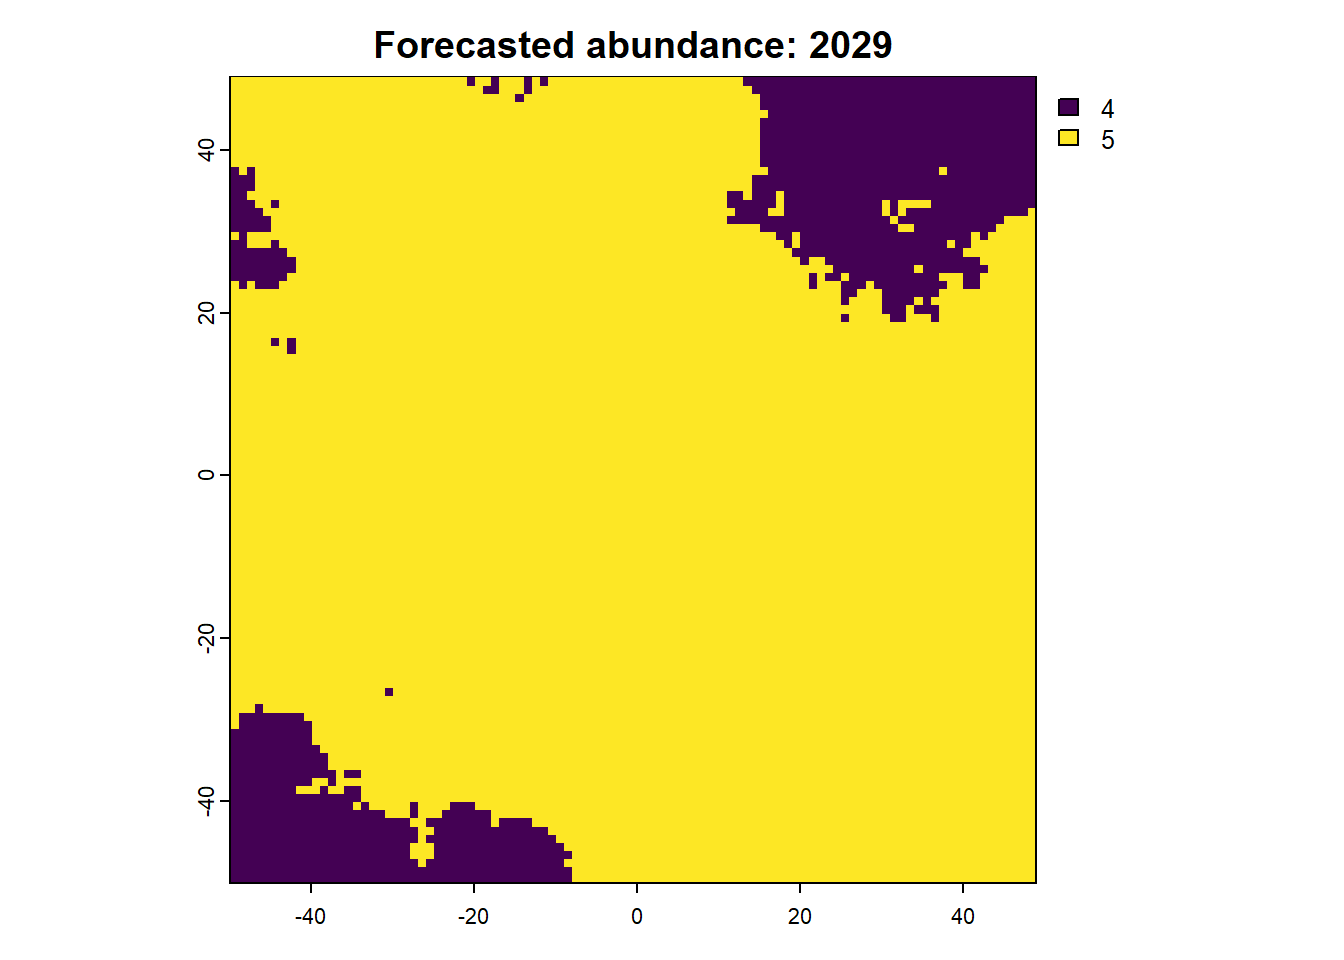
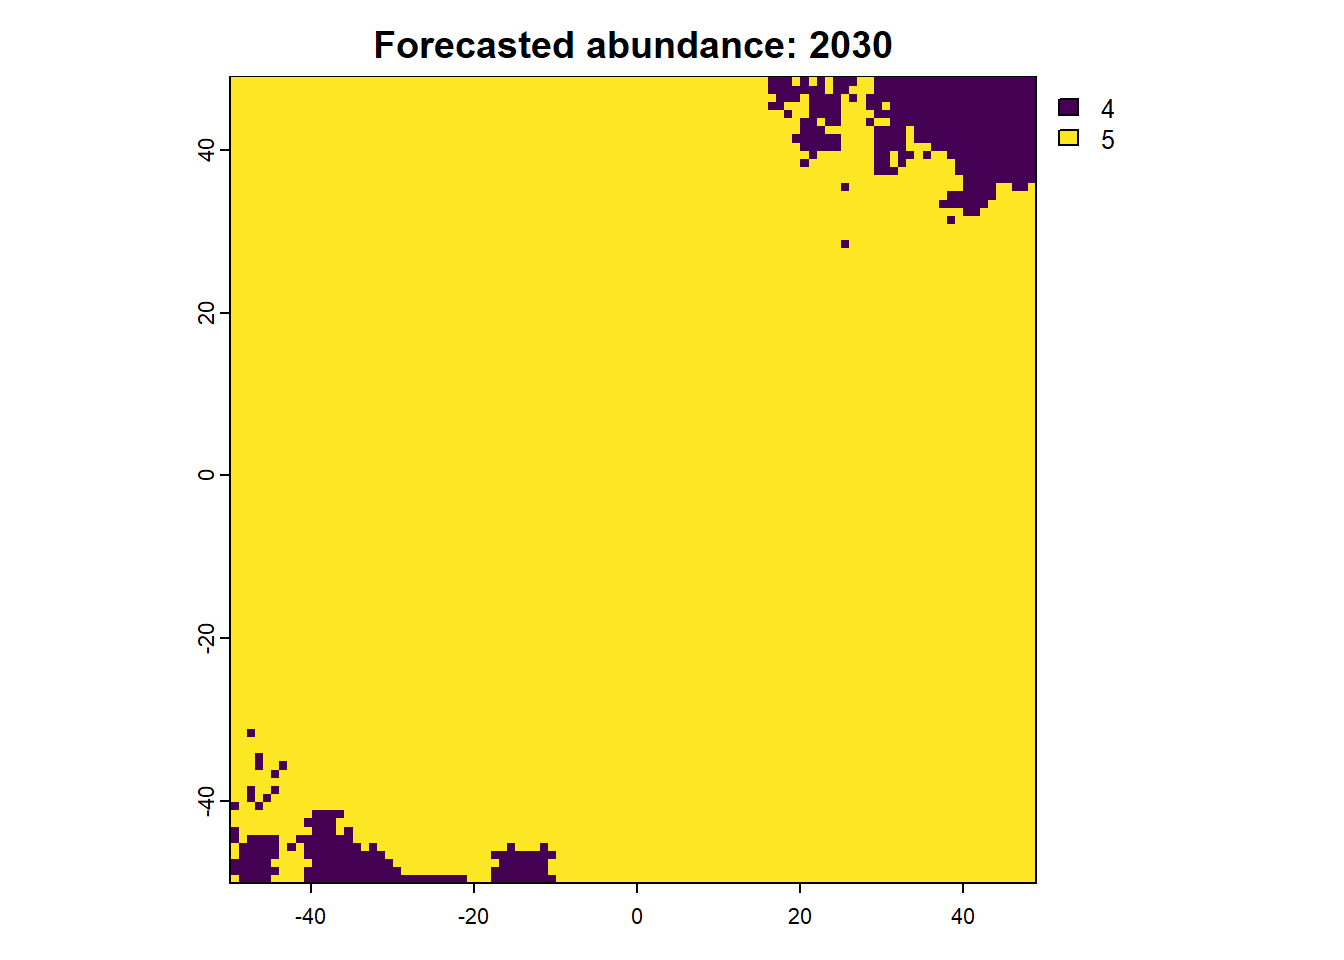
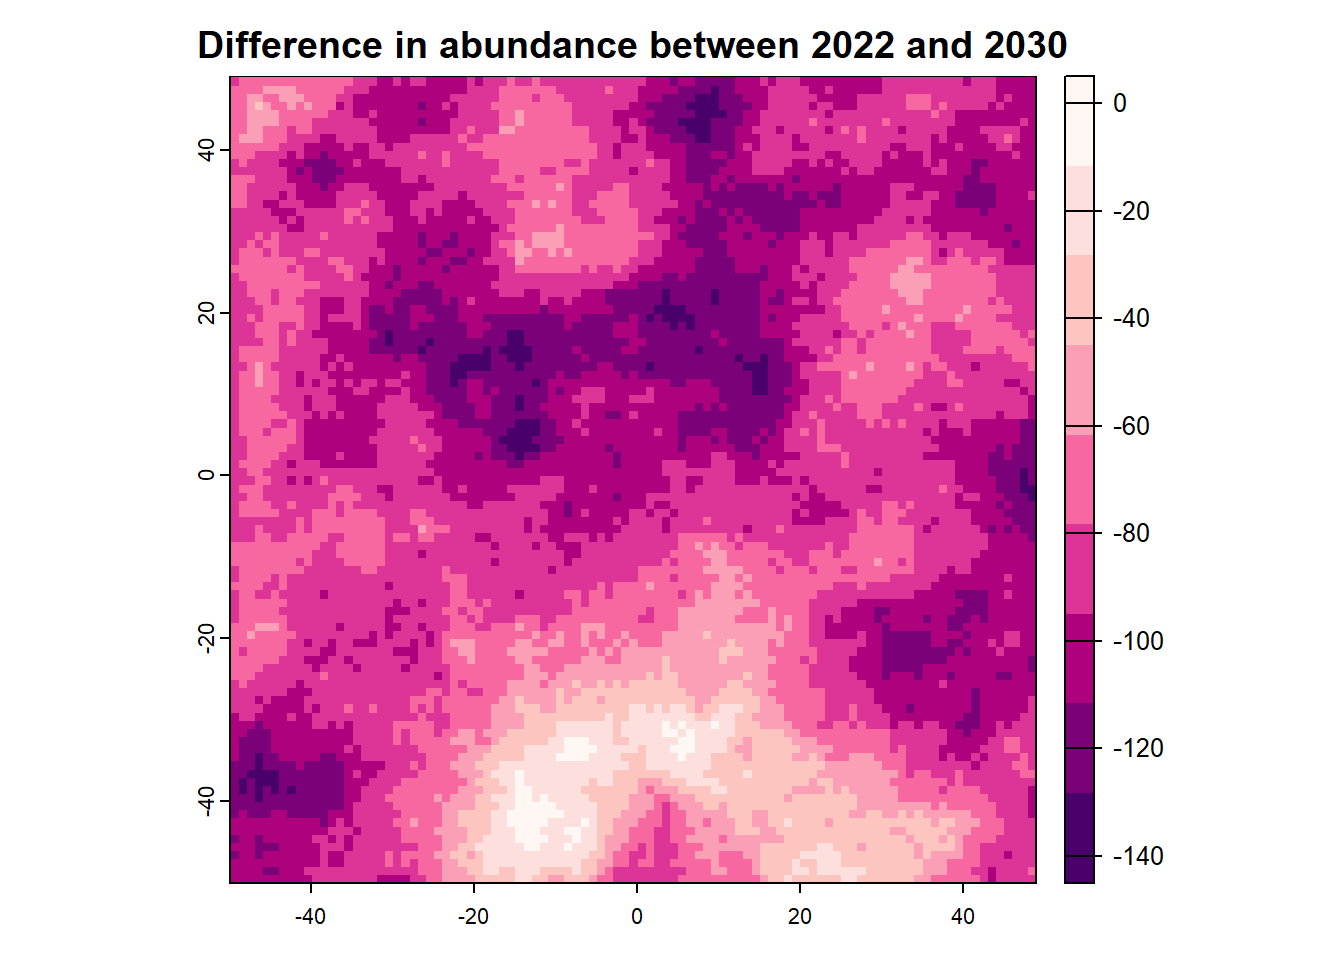
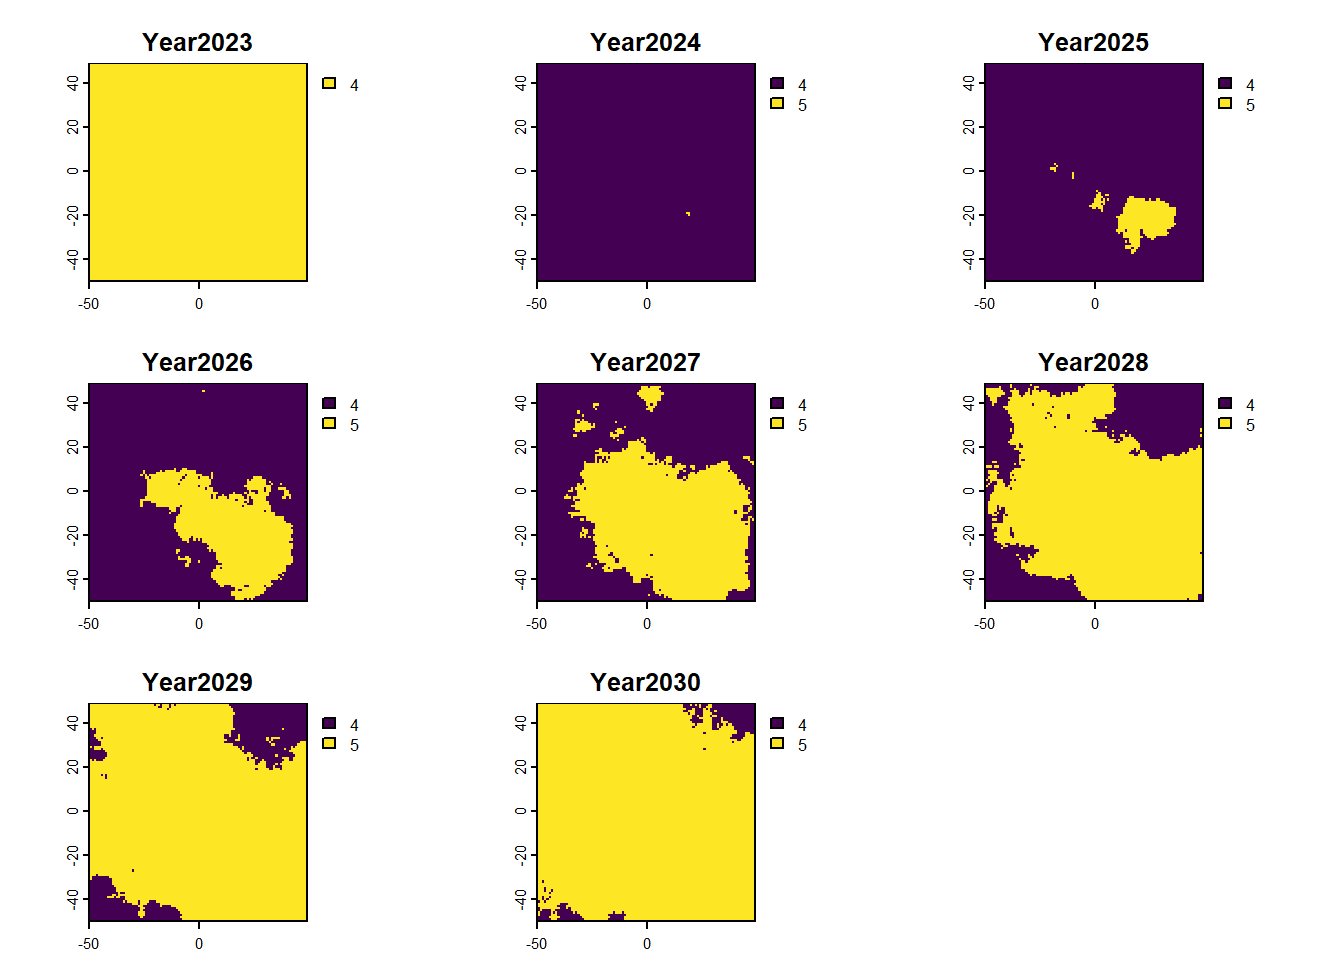
We can also access any objects and use them. For example, we can look at the forecasted abundances and the difference raster is also possible. This is done by calling the object name from the results list.
Code
:: plot (rast (results$ forecasts))
Examples
In the remaining chapters of this section, we will explore several examples, including learning of several arguments to the function setupProject. But we will start very simple first.
Barebones R script
Code
<- c ("predictiveecology.r-universe.dev" , getOption ("repos" ))# if (!require("SpaDES.project")) :: Install (c ("SpaDES.project" , "SpaDES.core" , "reproducible" ), repos = repos, dependencies = TRUE )= SpaDES.project:: .libPathDefault ("~/SpaDES_book/integratingSpaDESmodules" )= SpaDES.project:: .libPathDefault ("PredictiveEcology.org" )##################### PART II: Download the modules and install the needed packages <- SpaDES.project:: setupProject (paths = list (projectPath = "~/SpaDES_book/integratingSpaDESmodules" ,packagePath = packagePath),modules = c ("tati-micheletti/speciesAbundance@main" ,"tati-micheletti/temperature@main" ,"tati-micheletti/speciesAbundTempLM@main" ),times = list (start = 2013 ,end = 2030 ),updateRprofile = FALSE <- SpaDES.core:: simInitAndSpades2 (Setup):: completed (results):: moduleDiagram (results):: plot (rast (results$ forecasts))
